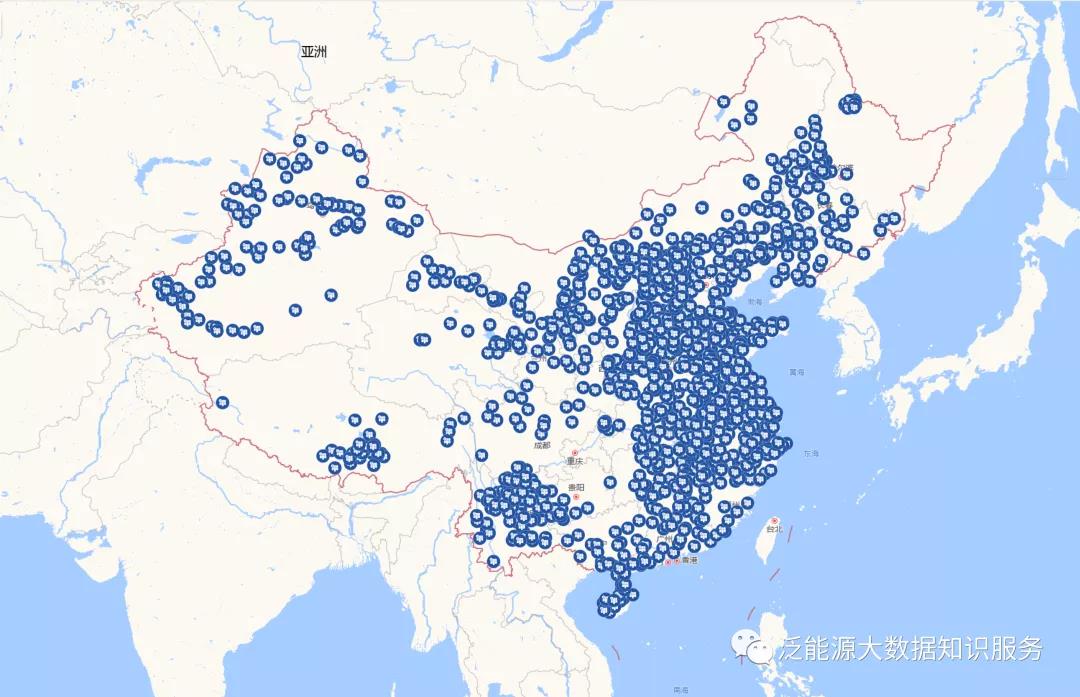
Distribution map of wind power and other power generation projects in China
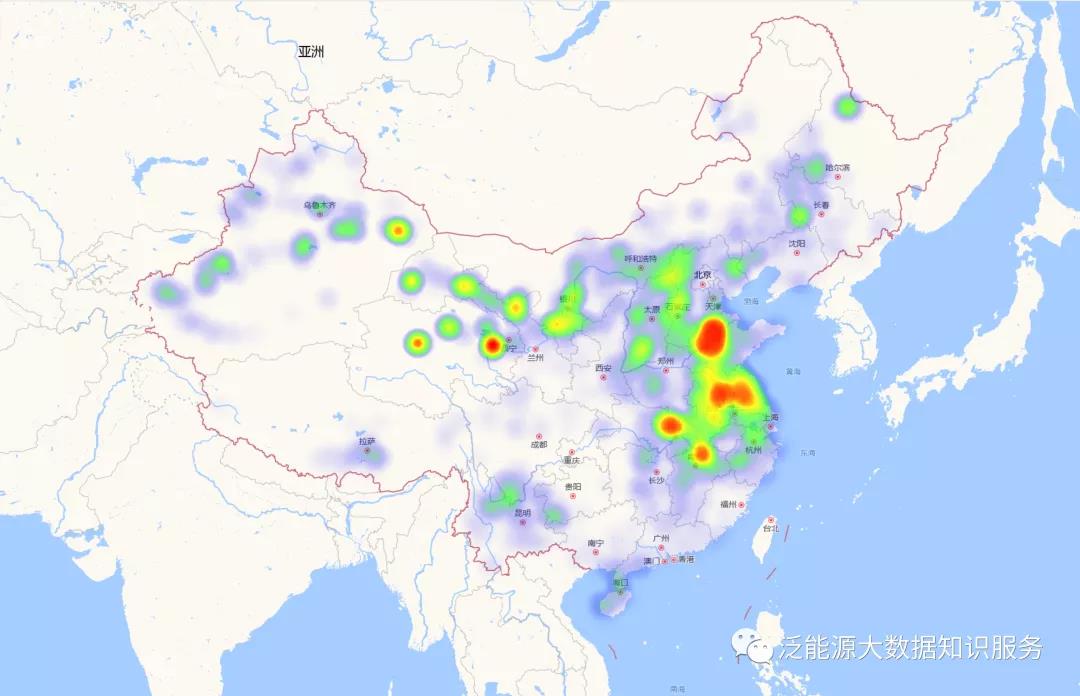
The distribution map of my country’s wind power and photovoltaic power generation projects compiled by the Pan-Energy Big Data and Strategic Research Center, Qingdao Institute of Bioenergy and Process Research of Chinese Academy of Sciences/Shandong Energy Research Institute, roughly shows that my country’s wind power projects are mainly distributed in the three north and east. The distribution of wind farms in coastal provinces and Yunnan and other places is relatively dense. According to the heat map of the distribution of wind power projects, Inner Mongolia, Hebei, Ningxia, Xinjiang, Northeast and Yunnan are more prominent.
As of the end of 2019, the distribution of wind power projects in my country is as follows:
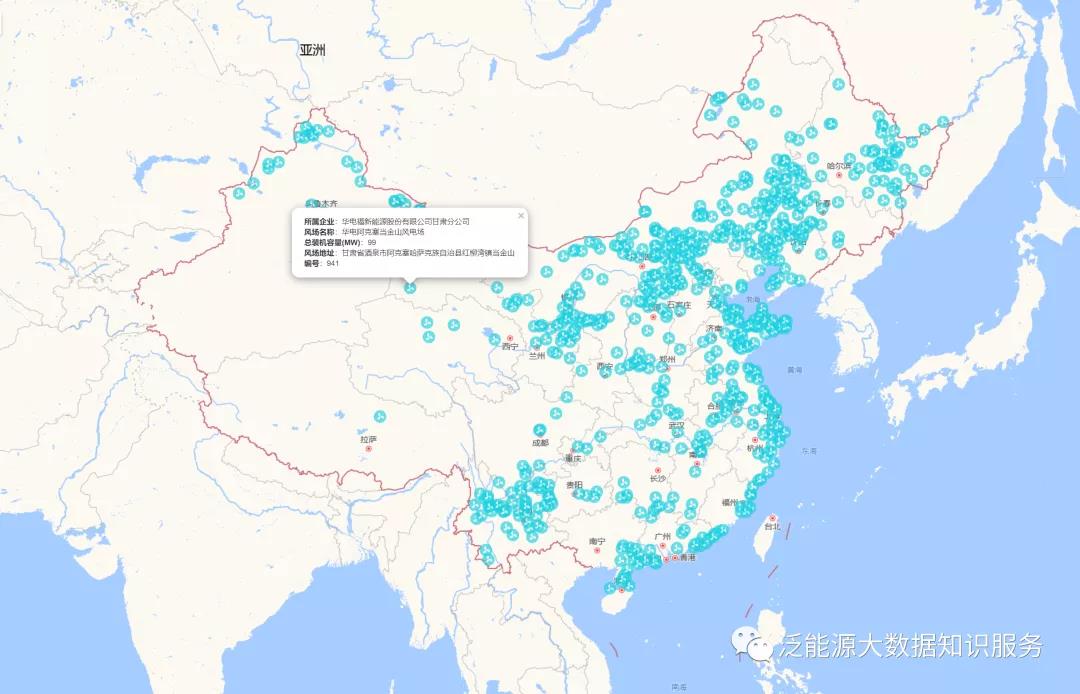
(Each round icon represents 1 wind power project)
The distribution heat map of wind power projects is as follows:
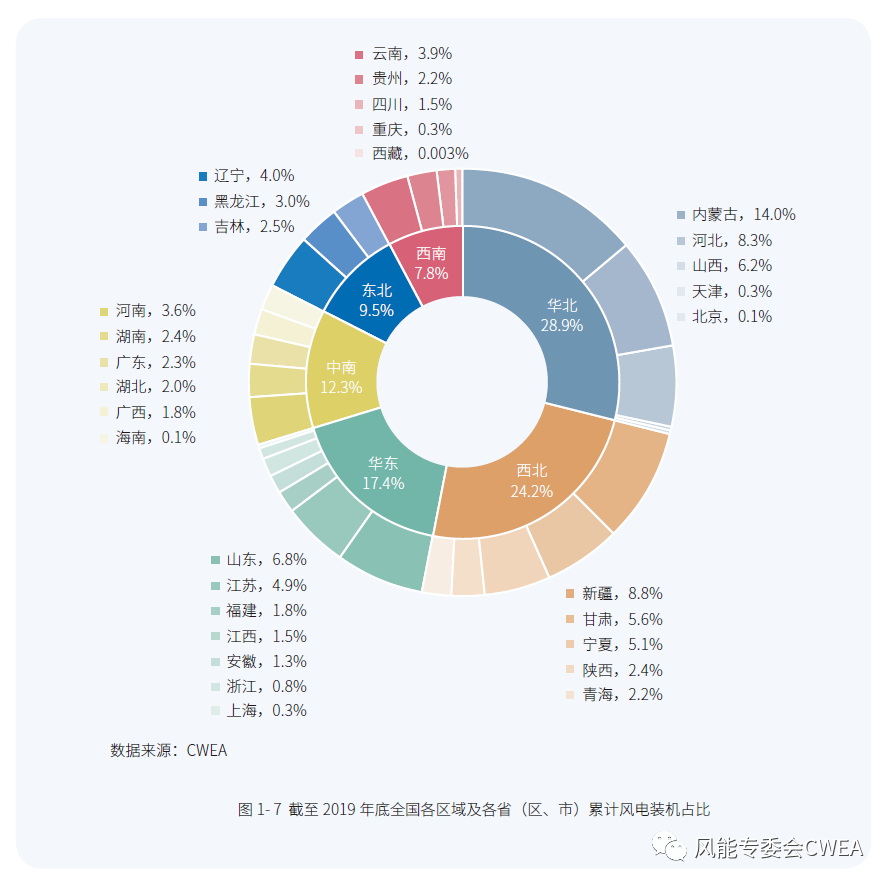
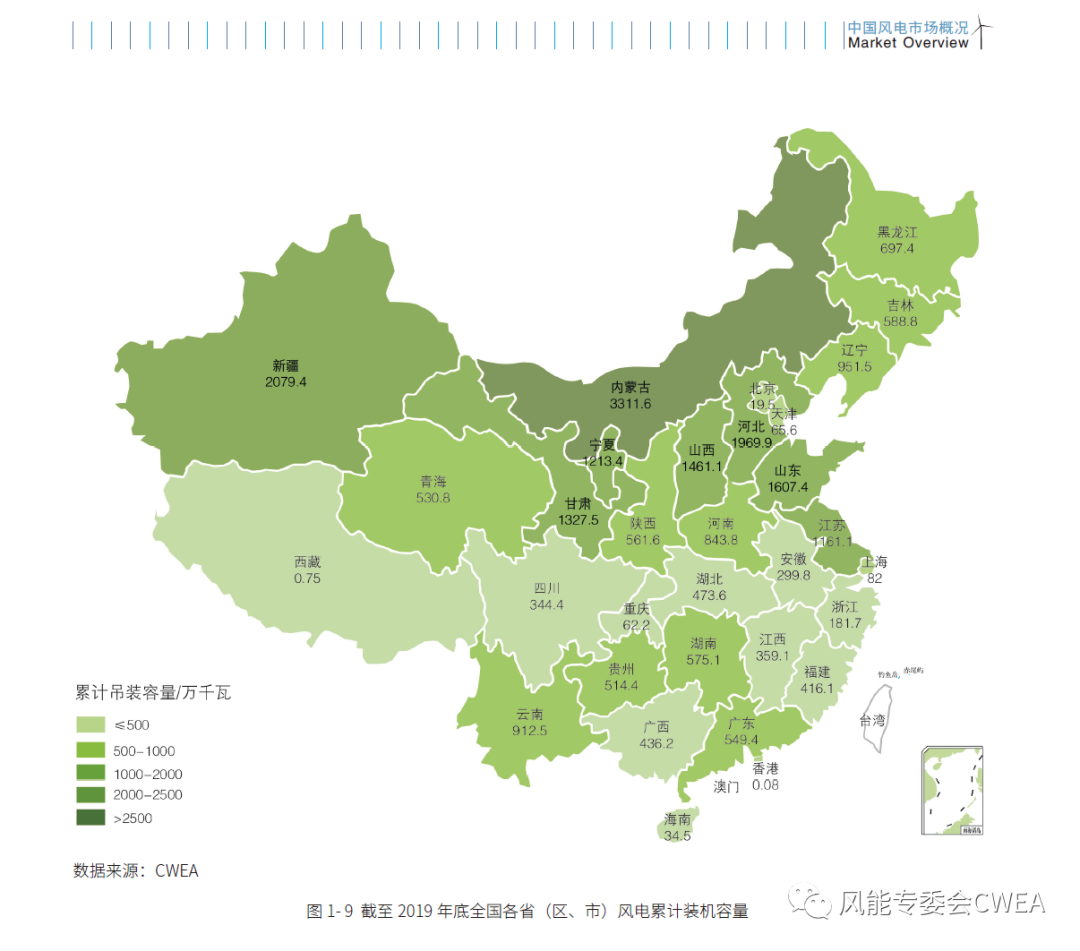
As of the end of 2019, the proportion of cumulative wind power installed capacity in all provinces (autonomous regions and municipalities) across the country
As of the end of 2019, among the six major regions in the country, North China had a cumulative installed capacity of 68.28 million kilowatts, accounting for 28.9% of the country’s cumulative installed capacity, including 14.0% in Inner Mongolia, 8.3% in Hebei, 6.2% in Shanxi, 0.3% in Tianjin, etc.; cumulative installed capacity in Northwest China 57.13 million kilowatts, accounting for 24.2% of the country’s cumulative installed capacity, including Xinjiang 8.8%, Gansu 5.6%, Ningxia 5.1%, etc.; East China’s cumulative installed capacity is 41.07 million kilowatts, accounting for 17.4% of the country’s cumulative installed capacity, including 6.8% in Shandong and 4.9% in Jiangsu %, Fujian 1.8%, etc.; Central and South China’s cumulative installed capacity is 29.13 million kW, accounting for 12.3% of the country’s cumulative installed capacity, including 3.6% in Henan, 2.4% in Hunan, and 2.3% in Guangdong. The cumulative installed capacity in Northeast China is 22.38 million kW, accounting for the country’s total The installed capacity is 9.5%, including 4.0% in Liaoning, 3.0% in Heilongjiang, and 2.5% in Jilin; the cumulative installed capacity in Southwest China is 18.34 million kilowatts, accounting for 7.8% of the total installed capacity in the country, including Yunnan 3.9%, Guizhou 2.2%, and Sichuan 1.5%.
As of the end of 2019, the cumulative installed capacity of wind power in all provinces (autonomous regions and municipalities) across the country
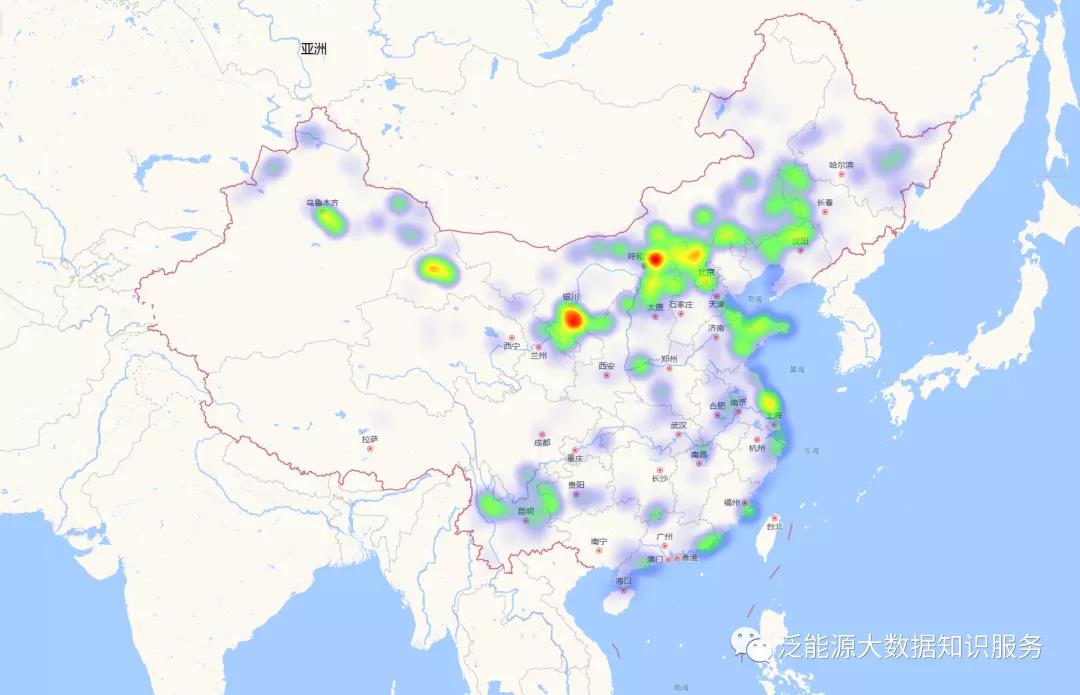
As of the end of 2019, the distribution of my country's photovoltaic power generation projects is shown in the figure
(Each round icon represents 1 photovoltaic power generation project)
The distribution heat map of photovoltaic power generation projects is as follows: